Preliminary real estate statistics for the third quarter are here. The in-depth analysis of the numbers is a work in progress and will be complete in a couple of weeks. If you are interested in my full analysis, be sure to reach out to me soon.
The total number of sales in some market areas are down when compared to the prior year, however, both median and average home prices continued their upward trajectory in most market areas and across all property types- single family, condominiums, and vacant land. This shows the continuation of the ongoing shortage of supply of properties in our local markets.
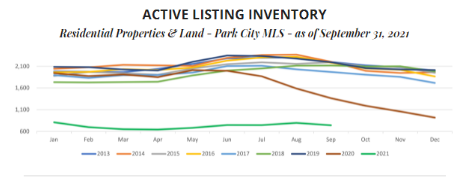
The month-to-month change in inventory turned downward in July, but toward the end of August began to rise again. However, this increase was short lived, as September closed nearly 100 listings down from August- a decrease of 12.5%. This end of summer downward trend is normal for our local market, and we will wait to see if the coming months deliver an increase in inventory.
So- what does all that mean? Your equity position is likely to be the highest it’s ever been. If your needs have shifted, this may be the optimal time to sell your property.